Fibonacci Retracement vs Expansion
7 min read · Updated Aug 21, 2026
Short answer
Both tools measure the same price leg, in opposite directions. A retracement measures how much of a completed move price gives back — the levels sit inside the leg, between its start and end. An expansion projects beyond the end of the leg to estimate how far the next move could travel. Retracement asks where a pullback may stop; expansion asks where the continuation may reach.
Fibonacci tools measure a single price leg — one clean move from a swing low to a swing high, or the reverse. Once that leg is anchored, two different questions can be asked of it, and each has its own tool.
- Retracement — how much of the move is being given back? Levels sit inside the leg.
- Expansion (also called extension) — how far could the next move run? Levels are projected beyond the leg.
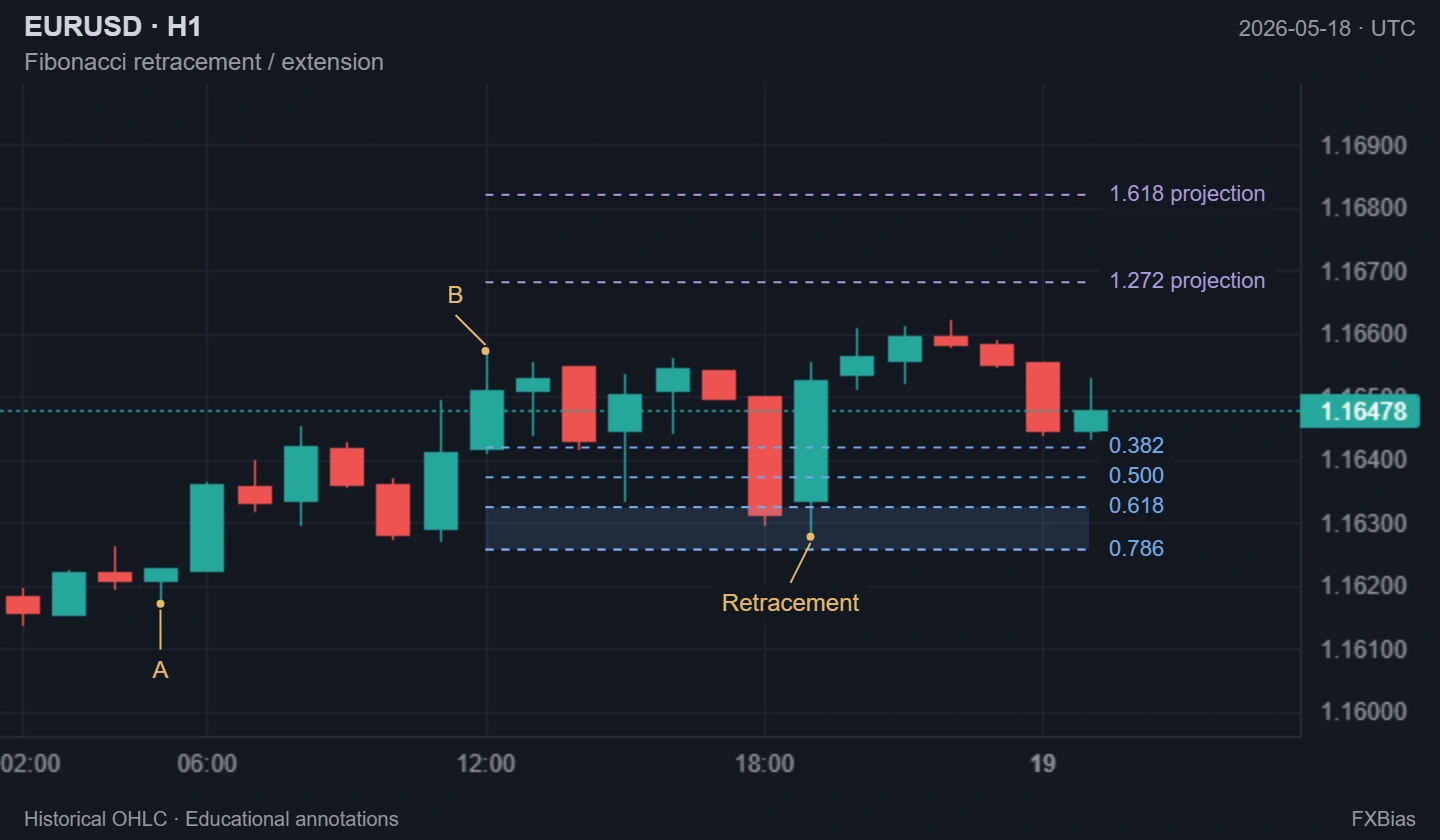 Historical exampleView full size ↗
TradingView Lightweight Charts™ © 2025 TradingView, Inc.
Where do the ratios come from?
The Fibonacci sequence starts 1, 1, 2, 3, 5, 8, 13, 21 — each number is the sum of the two before it. Divide any number by the one after it and the result converges on 0.618. Skip one and you get 0.382. Invert 0.618 and you get 1.618, the golden ratio.
Worth knowing: 0.5 is not a Fibonacci ratio. It is simply the halfway point of the leg. It stayed on the toolbar because traders found the midpoint useful, not because the maths produced it.
How a retracement is drawn
In an uptrend, anchor the tool at the swing low (0%) and drag to the swing high (100%). The levels then appear between them, marking how far a pullback has travelled back into the move:
- 0.382 — shallow. Often just a pause in a strong trend.
- 0.5 — the midpoint.
- 0.618 — the level that draws the most attention.
- 0.786 — deep. Beyond this, the original move starts to look questionable.
For a downtrend, anchor from the swing high to the swing low; the levels then measure how far price has bounced back up.
The 0.618–0.786 zone
The band between 0.618 and 0.786 is commonly called the golden zone — or the discount zone in Smart Money language, since price is trading at a discount relative to the leg that just happened. The reasoning is that a pullback this deep has given back most of the move without erasing it, and it often overlaps with structural areas like an order block or an unfilled Fair Value Gap. Where several of those things line up, the zone carries more weight than a ratio on its own.
How an expansion is drawn
An expansion uses the same leg but projects the ratios past its end. If a move ran 100 pips, the 1.618 expansion sits 161.8 pips from the origin — an estimate of where the next leg could reach if the move continues. Common levels are 1.272, 1.618 and 2.618.
Some platforms label this the extension tool and use three anchor points instead of two (start of the leg, end of the leg, end of the pullback). The names get used loosely and vary between platforms; what matters is the distinction — retracement measures inside the move, expansion measures past it.
Common mistakes
- Anchoring to the wrong swing. The tool is only as meaningful as the leg it is drawn on. Use clear, obvious swings — if you have to hunt for the anchors, the levels will not mean much.
- Treating a level as a signal. Price reaching 0.618 is not a reason to act. It is a place to start looking for confirmation.
- Redrawing until it fits. If the levels only work after moving the anchors three times, the analysis is fitting the chart rather than reading it.
- Ignoring the timeframe. A retracement on a 5-minute chart and one on the daily describe completely different things.
Does it work?
There is no mechanism in a market that forces price to turn at a ratio derived from a number sequence. What gives these levels any influence is far more mundane: a large number of traders and automated systems watch the same ones, so orders cluster around them. That makes the levels worth knowing — and it also means they behave like any other area of interest, working sometimes and failing other times.
The practical use is as a framework for measuring pullbacks and projecting objectives consistently, combined with market structure rather than used alone.
Frequently asked
What is the difference between Fibonacci retracement and expansion?
A retracement is measured inside a completed price leg and describes how much of that move is given back — 0.618 means price has returned 61.8% of the way. An expansion is projected beyond the end of the leg and describes how far a continuation could travel — 1.618 means an extension of 161.8% of the original leg. Same anchors, opposite side of the move.
Where do the Fibonacci ratios come from?
From the Fibonacci sequence (1, 1, 2, 3, 5, 8, 13...). Dividing a number by the next one converges on 0.618, skipping one gives 0.382, and the inverse of 0.618 is 1.618 — the golden ratio. The 0.5 level is not a Fibonacci ratio at all; it is simply the midpoint, kept because traders find it useful.
Why do traders focus on the 0.618 and 0.786 levels?
Together they form what many call the golden zone or discount zone: deep enough that price has given back most of the leg, but not so deep that the move is invalidated. A shallow 0.382 pullback is often just a pause, while a break beyond 0.786 suggests the original move may have failed.
Does Fibonacci actually work?
There is no mechanism that forces price to respect a ratio. What gives these levels influence is that a large number of traders and automated systems watch the same ones, which concentrates orders around them. Treat them as areas of interest that need confirmation from structure or price action, not as signals on their own.
Continue reading
Apply this with FXBias daily briefings
Start Free