

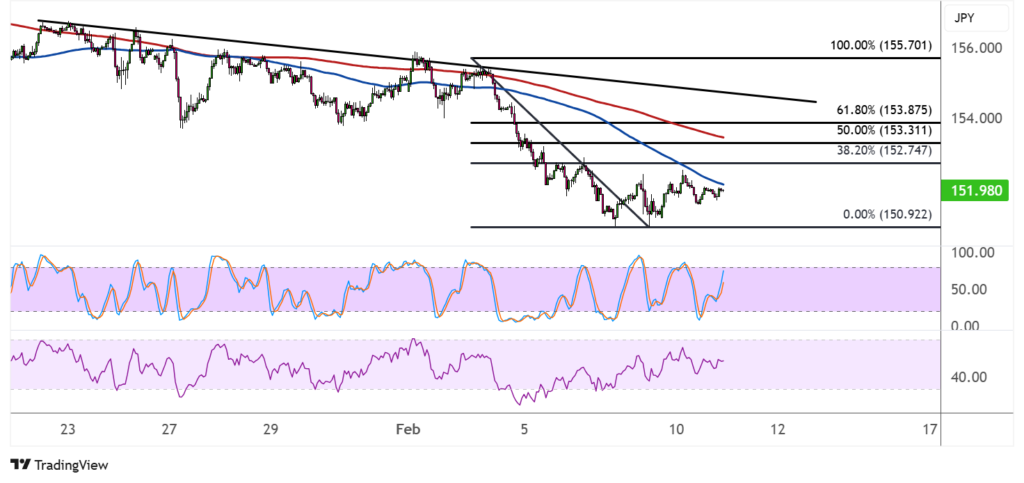
USDJPY has formed lower highs connected by a falling trend line that’s been holding since last month. Price could be in for a pullback to this resistance zone that coincides with Fibonacci retracement levels.
The 100 SMA is below the 200 SMA to suggest that the path of least resistance is to the downside or that the selloff is more likely to gain traction than to reverse. The gap between the indicators is widening to reflect strengthening selling pressure.
The 100 SMA is close by and could already hold as dynamic resistance around the 152.00 major psychological mark, but a higher pullback could still reach the 50% Fib at 153.31 near the 200 SMA dynamic inflection point. The 61.8% Fib lines up with a former support zone near the 154.00 major psychological level and trend line.
Stochastic is still on the move up to show that buyers are in control until the oscillator reaches the overbought zone and turns lower to indicate a return in selling pressure. RSI is on middle ground to reflect consolidation, barely offering directional clues at the moment.
USDJPY could take cues from upcoming US CPI data, as a weak inflation print could revive calls for more aggressive Fed rate cuts, leading to downside pressure for USD. On the other hand, stronger than expected inflation results could mean more upside for USD since this would reinforce the Fed’s latest shift to a less dovish stance.
Meanwhile, JPY could also draw support from safe-haven flows, especially if traders are keen on staying away from USD in relation to tariffs headlines. So far, US President Trump has announced 25% tariffs on aluminum and steel imports, leading to another set of uncertainty in the markets.
The BOJ recently started its tightening cycle and officials have indicated scope for more rate hikes in their next meetings, likely keeping the yen bid.
Source: fxdailyreport.com/